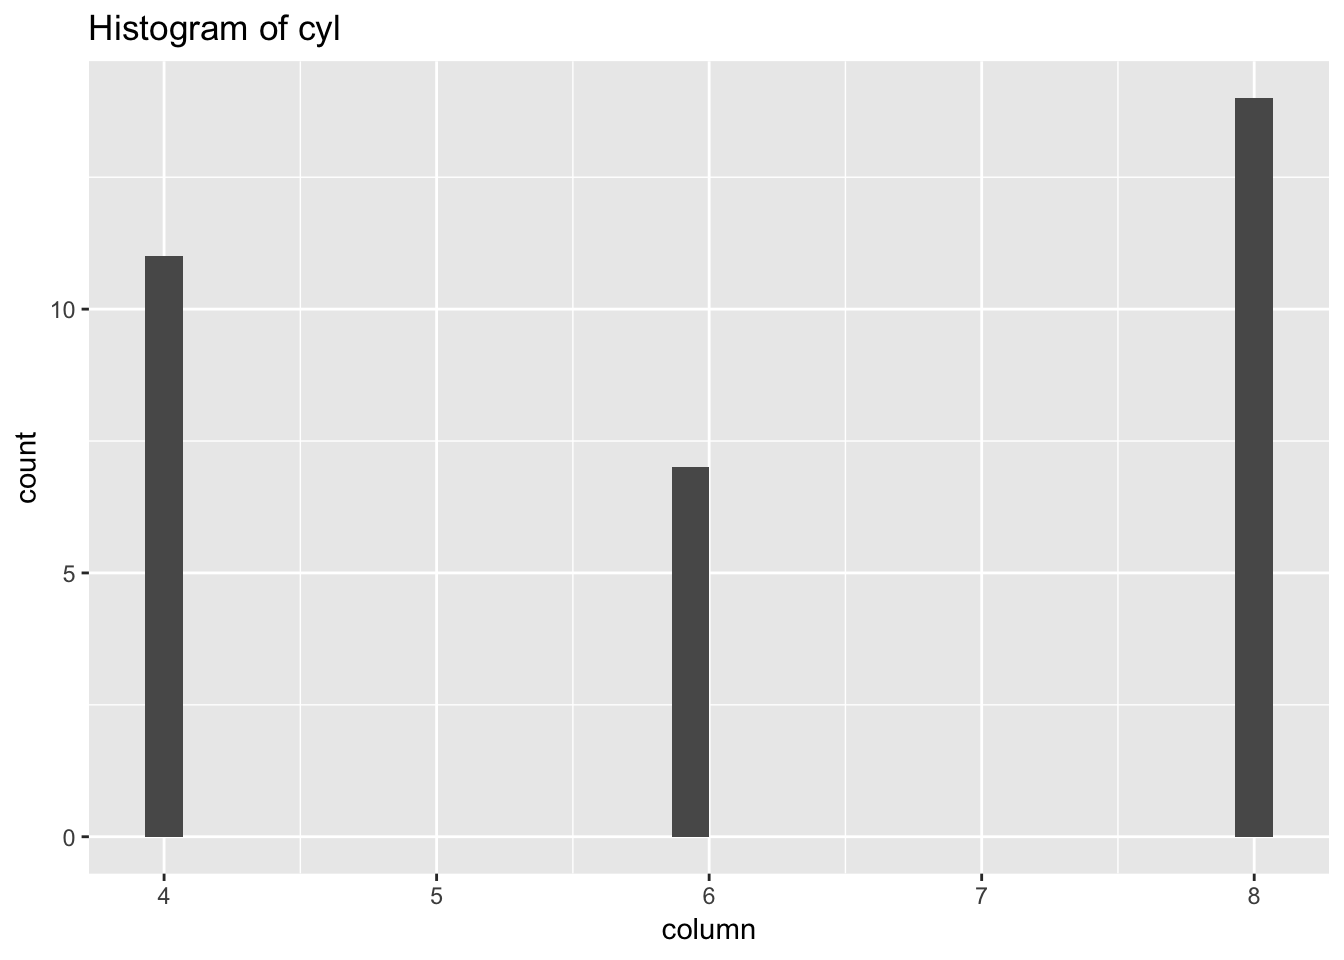
I’m learning data.table. Recently I needed to plot a histogram of some particular columns. I already learned to use .SDcols and .SD to get at particular columns and subsets, but I couldn’t figure out how to refer to the column’s name in the plot itself.
Eventually I settled on the approach of mapping over the indices of the data set and getting the correct column data and name during each lapply iteration.
Let me know your ideas for improvement. Like I said, I’m still learning data.table, so I’m sure I have much to improve. Here’s my code:
histogram_my_columns <- function(data, columns = NULL) {
  require(data.table)
  require(ggplot2)
  if (!is.data.table(data)) {
    data <- as.data.table(data)
  }
  if (is.null(columns)) {
    columns <- names(data)
  }
  stopifnot(all(columns %in% names(data)))
  plotter <- function(index) {
    column <- data[[index]]
    column_name <- columns[index]
    p <-
      ggplot() +
      geom_histogram(aes(column)) +
      ggtitle(paste0('Histogram of ', column_name))
  suppressMessages(print(p))
  TRUE
  }
  res <- data[, lapply(seq_along(.SD), plotter), .SDcols = columns]
}
suppressPackageStartupMessages(library(data.table))
suppressPackageStartupMessages(library(ggplot2))
histogram_my_columns(mtcars, c('mpg', 'cyl', 'disp'))

